
In Zemax's Non-Sequential Mode, detectors are used to capture information about the rays in the system. Various types of detectors can be employed to capture different aspects of the optical system's performance, such as Detector Rectangular, which stores energy data from NSC source rays that strike it.
Another often visited detector type would be Detector Color, which is a flat rectangular detector with an arbitrary number of pixels. This detector can record and display incoherent illumination data defined by tristimulus response. This detector can accurately record and display the color of illumination. The Detector Color object stores power and tristimulus (visual light color) data from NSC source rays that strike it. The resulting data distributions may be viewed for incoherent light in spatial or angular domains. This object may optionally store the spectral distribution for all NSC source rays that strike it (see the description for "Record spectral data" given under the "Type tab" ). Detector Color objects may be reflective, transparent, or absorbing if the material is set to "MIRROR", blank, or "ABSORB", respectively.
The True Color option in Detector Color creates an RGB color representation of the detected illumination by converting the wavelengths to the closest RGB equivalent and summing over all wavelengths. The accuracy of the True Color presentation is limited by the RGB method of rendering color on a computer display; and it is not possible to exactly represent monochromatic colors.
Below is a two-LED model in Zemax to demonstrate the Detector Color application (Figure 1). The wavelengths of the two LEDs are set as 460 nm and 570 nm (Figure 2), i.e. blue and yellow lights. The Color option in the Detector Color used to define how the detector is displayed on shaded model plots. In this case, 4 denotes true color. These two LED sources are placed individually in the upper row and mixed in the lower row with an identical incident angle of 25 degrees. The whole setup is shown in Figure 3.
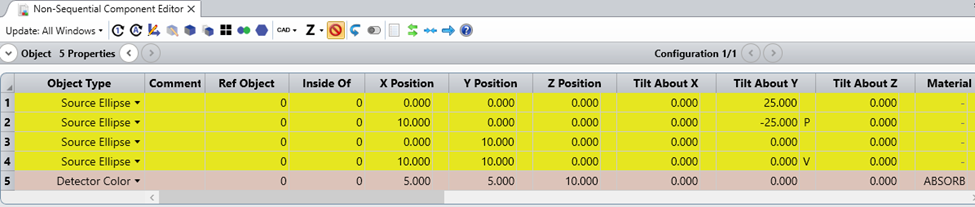
Figure 1 Component list of LEDs and a Color Detector
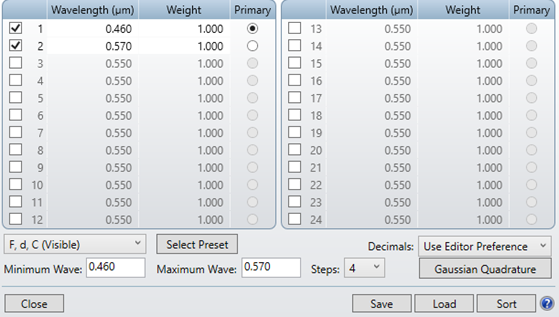
Figure 2 Emission spectrum definition of LEDs
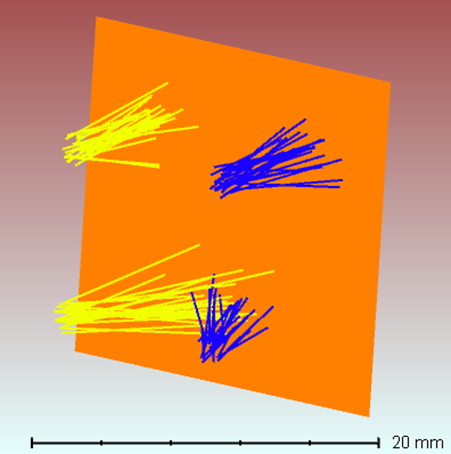
Figure 3 Whole system layout including 4 LEDs and a color detector
If we go to settings of Detector Viewer for Detector Object 5, choosing True Color under Show As, color presentation in the color detector is presenting, As shown in Figure 4. The upper row presents the individual color of the two LEDs, while the mixed color is presented in the bottom – pretty closed to white.
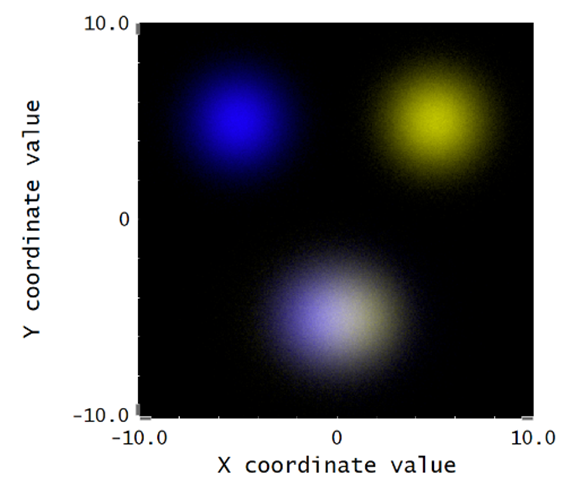
Figure 4 Detector True color view of the individual LED illumination and mixed LED illumination
In the Text tab of the Detector Viewer, Power values and Tristimulus in X, Y, Z values are shown in the format of pixels defined in the detector, with unit of Watts/mm^2. Tristimulus in X, Y, Z values denote the components in RGB at each pixel.
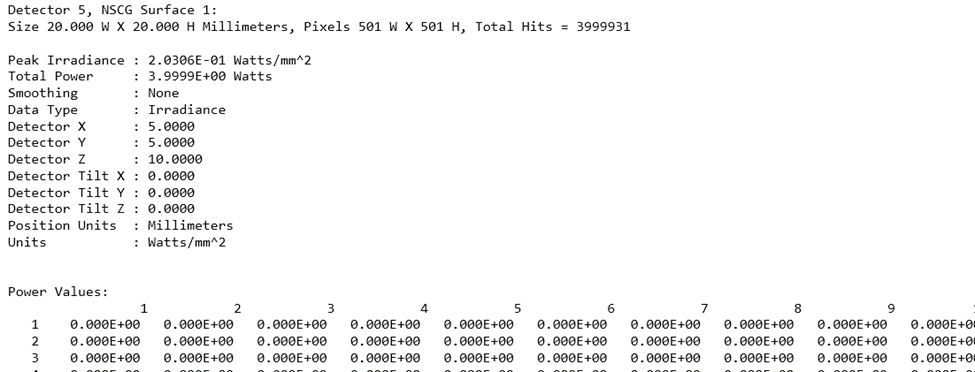
Figure 5 Detector Data presentation of individual and mixed LED illumination
The Tab of Save Detector Data under Detector Tools saves the data for the detector currently selected in the editor. The file format and data stored is specific to the detector type, for Detector Color, the distinct extension is DDC to denote the file formats.
Lastly, let’s change the input color group from Yellow and blue to red and blue to see how the detector illustrates the mixed color – purple in Figure 6.
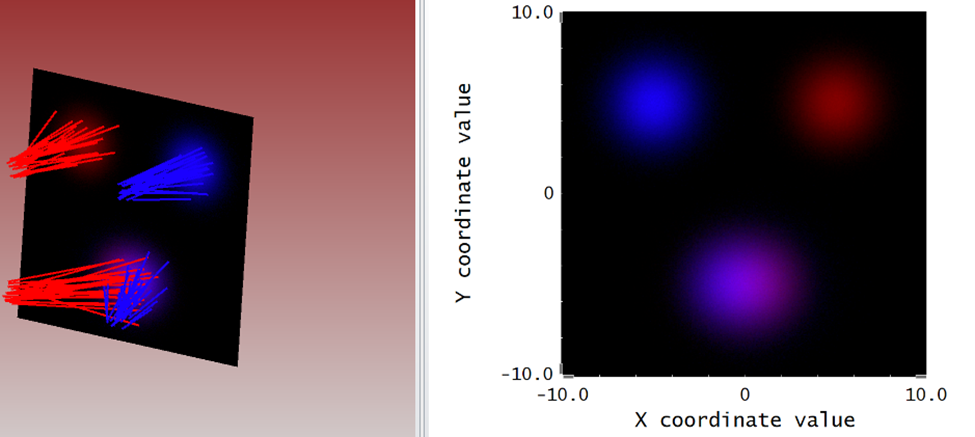
Figure 6 Mix of red and blue to form purple illuminance
In Summary, when working with a color detector, we typically simulate it by using a combination of wavelength-dependent detectors or by considering the spectral response of the detector. The tristimulus values (X, Y, Z) or color information can be extracted by analyzing the response of the detector to different wavelengths of light.
