
Bridging the Gap: From Stack to FDTD Simulations
The journey of micro-LED optimization begins with a foundational understanding of stack simulations. As a 1D analytical tool, stack simulations offer a preliminary glance at the optical behavior across layered structures of micro-LEDs. Ideal for initial analyses, these simulations provide quick insights into the light emission and interaction within straightforward, layered geometries.
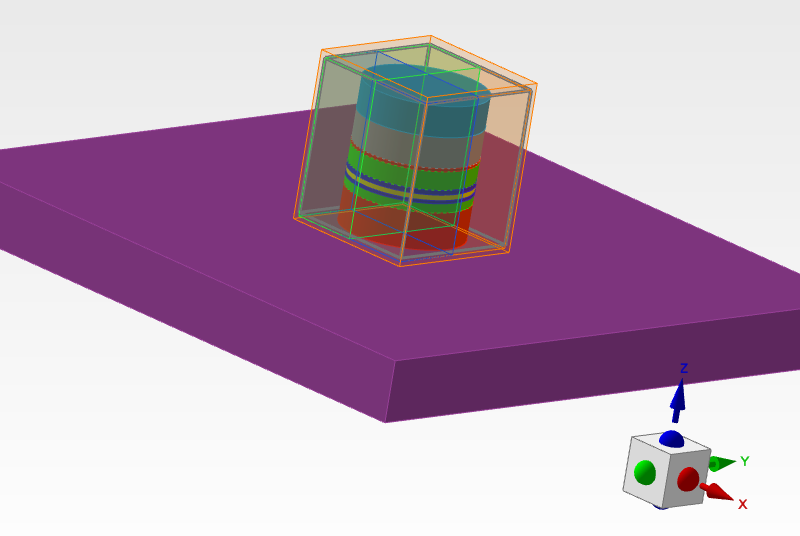
Figure 1 illustrates the micro-LED geometry.
However, as we delve into the intricate architectures that characterize modern micro-LEDs, the limitations of stack simulations become apparent. Complex designs demand a more robust analytical approach, capable of navigating the three-dimensional intricacies of micro-LED structures.
The FDTD Paradigm: Unraveling Complexity
Unlike its 1D counterpart, FDTD offers a dynamic, three-dimensional simulation environment, meticulously unraveling the electromagnetic field behaviors in real-time. This method shines in its ability to model complex geometries, simulate dipole sources accurately, and analyze interactions within the micro-LED, offering detailed insights into:
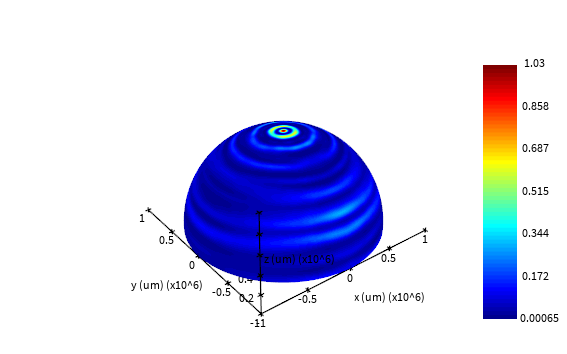
Near-Field and Far-Field Patterns: Understanding the electromagnetic distribution around micro-LEDs is crucial for optimizing device design and functionality. Figures2 (a) and (b) shows the farfield at different wavelength.
(a)
(b)
Figure 2 shows the far-field (a) 𝜆=0.7 𝝁m (b) 𝜆=0.56 𝝁m
Power vs. Angle (Theta) Relationships: This analysis helps in fine-tuning the directional emission characteristics of micro-LEDs, enhancing device efficiency and output.
Figure 3 demonstrates the Power vs. Angle
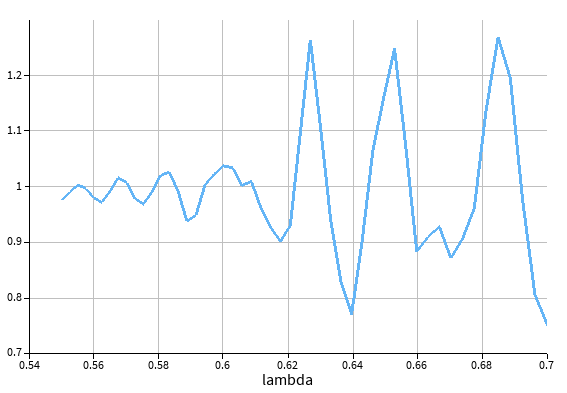
Purcell Effect Implications: Evaluating how the Purcell effect influences spontaneous emission rates provides a pathway to boosting the efficiency of light emission.

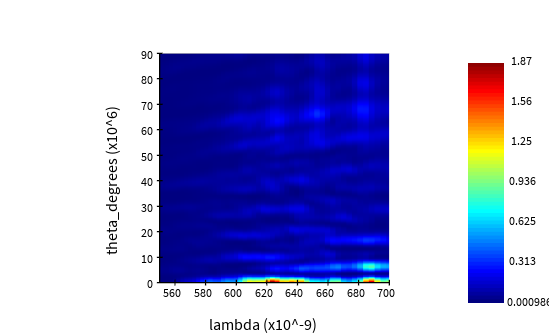
Figure 4 illustrates the Purcell factor
Overall Efficiency Metrics: FDTD simulations assist in quantifying the device's power output, highlighting the conversion of energy into usable light.
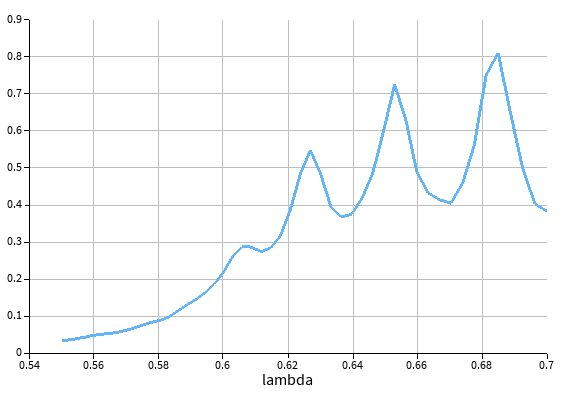
Figure 5 shows the transmission
To truly appreciate the depth of insights provided by FDTD simulations, incorporating specific data plots can significantly enhance comprehension and application:
Emission Profile Comparisons: Visualizing how light emission varies between stack and FDTD simulations can underscore the added value of adopting a more detailed simulation approach.
Efficiency Improvements: Graphs showcasing efficiency enhancements post-FDTD optimization offer tangible evidence of the method's impact on micro-LED design.
The integration of stack and FDTD simulations represents a holistic approach to micro-LED design and optimization. As we venture further into this technical realm, the fusion of these methodologies not only demystifies the complexities of micro-LED technology but also paves the way for groundbreaking innovations in device performance and application.
Please watch these videos to understand the workflow of Ansys Lumerical for Micro LED simulation and the details of FDTD.