The Growing Role of Automation in Optical System Design
In the field of optical engineering, efficiency and precision are paramount. From designing cutting-edge imaging systems to optimizing performance metrics, engineers need tools that streamline workflows while delivering reliable results. Automation has become a cornerstone of modern optical design, enabling engineers to extract and analyze data more quickly, customize simulations, and improve decision-making processes.
Python, a versatile programming language, plays a pivotal role in this evolution. By integrating Python with Zemax OpticStudio, engineers can unlock powerful capabilities for image analysis, performance evaluation, and data visualization. Whether you’re new to Zemax or looking to enhance your workflows, understanding how Python APIs can augment optical design is essential.
Why Use Python for Image Analysis in Zemax?
Optical systems, such as lenses and imaging devices, require precise analysis to ensure they meet design specifications. While Zemax OpticStudio provides robust tools for simulating and analyzing optical performance, incorporating Python into your workflow takes things to the next level. With Python, you can automate complex tasks, process large datasets, and generate customized visualizations that go beyond the standard GUI capabilities.
Some common use cases for Python in Zemax include:
- Spot Diagram Analysis: Automating the retrieval of spot size, centroid, and distribution data.
- Point Spread Function (PSF): Extracting and analyzing PSF data arrays for deeper insights.
- Spatial Frequency Response: Evaluating how spatial frequencies are transferred through the optical system.
By leveraging Python's extensive libraries—such as NumPy for data processing, Matplotlib for visualization, and OpenCV for advanced image manipulation—you can streamline your optical design process and achieve results more efficiently.
Python API in Zemax: Enhancing Image Analysis and Automation
Python API in Zemax
Image analysis with Python in Zemax involves using Zemax OpticStudio's ZOS-API to perform tasks like retrieving optical performance data. Common image analysis tasks in Zemax include retrieving spot diagram data from Zemax and analyzing spot size, centroid, or distribution, extracting point spread function images or data arrays for further analysis, analyzing spatial frequency response of the optical system, and measuring how spatial frequencies are transferred through the optical system.
Usually required Python environment for image analysis are exampled below: PythonNet for interacting with ZOS-API; NumPy and Matplotlib for data analysis and visualization; OpenCV for advanced image processing.
Lens System Description
Here is an example of Zemax imaging 3-piece lens structure in sequential mode, with the lens layout shown afterwards.


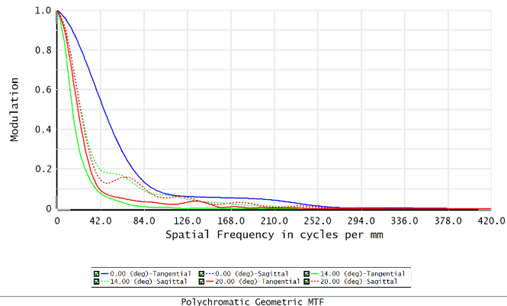
Here we present modular transfer function (MTF) in Zemax GUI interface below:

Python Code to Generate Image Analysis
The Python interpreter is 3.12.4, acquired from https://www.python.org/downloads/. The python compiler in this instance is spyder 5.5.1, integrated in Anaconda 3, acquired from https://www.anaconda.com/download/. To execute plot commands in Zemax, the Matplotlib package of Python is required. Here we use the version of 3.8.4. To pull up such package information, the command below is executed:
![]()
For the executable lens file in this case, first locate it in the example folder of OpticStudio, \\Sequential\\Objectives\\Cooke 40 degree field.zos, with the code below:

Based on this file, then creating a new analysis of with the code below, with analysis properties. The command ApplyAndWaitForCompletion runs the analysis with the current settings and waits for it to finish calculating.

The code chunk defines the presence of the lines in the plot. This functionality extends the ability of the Zemax GUI in color setting.

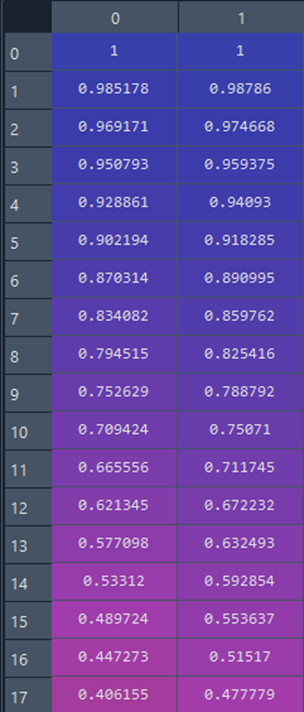
By default, the yRaw contains both datasets in tangential and sagittal. The command zos.reshape separate the both direction into two data columns to represent each direction. Such data ETL (extract, transform, load) process using Python is convenient and efficient. Especially in scenarios of extracting and reformatting big datasets.


While the upper functionalities of ETL are realized by data processing package of Matplotlib, an alternative way can be applying Numpy package for such ETL process. The corresponding data reorganizing code with Numpy for testing was below. The command “tuple” is used for indexing, specifying shapes. while the shape of a NumPy array is a tuple that describes the size of the array in each dimension. Command “tuple” in NumPy are for handling multidimensional arrays and indexing or relevant operations efficiently.

Then the plot is generated with settings of title, labels and legend settings below. The legend must follow the sequence that the curves were generating, i.e., direction (tangential and sagittal) first, then three fields (0 to 20 degrees).

The MTF generated with data format set in the code is below. This plot shows the final presence defined by the code with all loop steps. The legend is listed as requested by the code above to match the loop sequence of generating the overlapped plots.

Interactive Plot
Sometimes an interactive plot is convenient for observing or editing those lines. Here is a method to pull up a middle-step plot in a whole loop with Matplotlib. In Spyder console, type the “magic command” below to generate a floating plot.

In the code above, qt is a graphics library. The separate icon of the figure is generated, with the requested lines displayed. It allows interactive observing and adjusting the plot like scales and labels. Compared to the fixed plots generated in the last, this feature provides a flexible window in the middle step to customize the display of required curves.


Ozen Engineering Expertise
Ozen Engineering Inc. leverages its extensive consulting expertise in CFD, FEA, optics, photonics, and electromagnetic simulations to achieve exceptional results across various engineering projects, addressing complex challenges like multiphase flows, erosion modeling, and channel flows using Ansys software.
We offer support, mentoring, and consulting services to enhance the performance and reliability of your hydraulic systems. Trust our proven track record to accelerate projects, optimize performance, and deliver high-quality, cost-effective results for both new and existing water control systems. For more information, please visit https://ozeninc.com
Nov 19, 2024 10:37:37 AM
