
Studies have shown, improved room ventilation greatly reduces the spread of infectious diseases. All of us living through the Covid-19 pandemic have an interest in making indoor space safer and reduce potential transmission of disease.
Background
Disease spread in indoor spaces can be divided into near and far transmission. Near is when droplets from a cough can reach you… kind of like this.
Far transmission is the possible infection from small aerosol particles suspended in the air.
We must use a layered approach to defend against both methods of transmission. For near transmission, masks and social distancing is widely recognized as good solutions. In far transmission, the most effective technique for reducing spread is through increased ventilation.
Ventilation helps to reduce the rate of disease transmission by reducing the build up of aerosol in a room and there-by reducing the viral load of occupants in the room.
Quantifying ventilation
Ventilation and indoor air quality is typically measured using the number of Air Changes per Hour (ACH).
Here are some example ACH values for minimum ventilation rates.
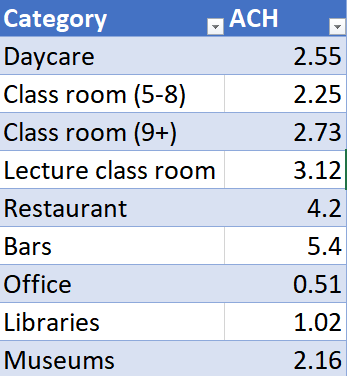
Infectious disease studies have shown that ACH of 5-6 can significantly reduce disease transmission. Looks like we have some work to do to make school classrooms achieve this level, and a lot more ventilation is needed on offices, libraries and museums.
ACH is typically calculated as
ACH=Total Air Supply Rate (ft^3/min)*60(min)/Volume of Space (ft^3)
This type of simplified calculations is at best a rough estimate because it does not take into account
-
Air recirculation and flow patterns
-
Circulation fans and filters
-
Open windows or doors.
Example
Here is a typical class room. 920sqft with 10ft ceiling
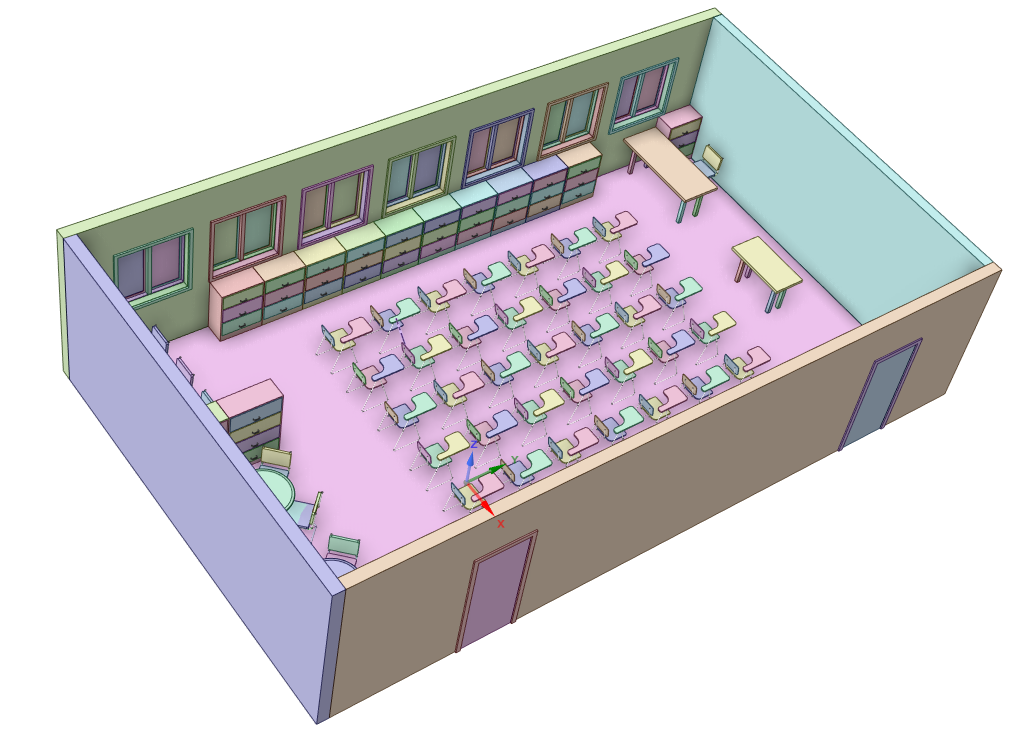
Typical classroom 9200 cubic feet
To reach a ACH value of 2.73, we need to supply this room with a little over 400 cubic feet of clean air per minute. This ACH value is lower than the recommended values for reducing disease spread, but we will use this as a baseline.
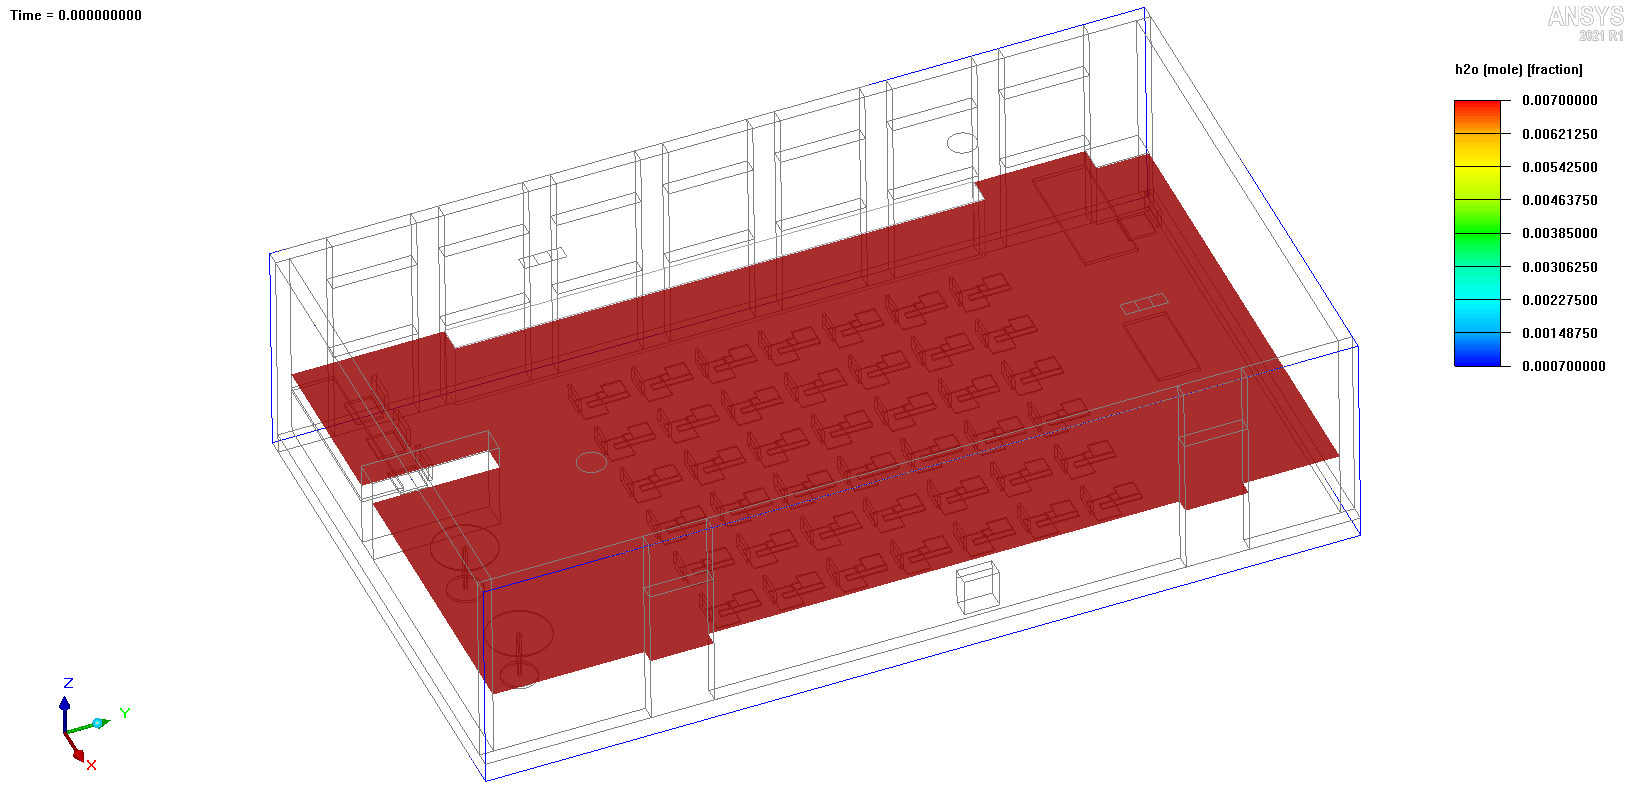
Here is what happens at 1m above ground in this baseline scenario.
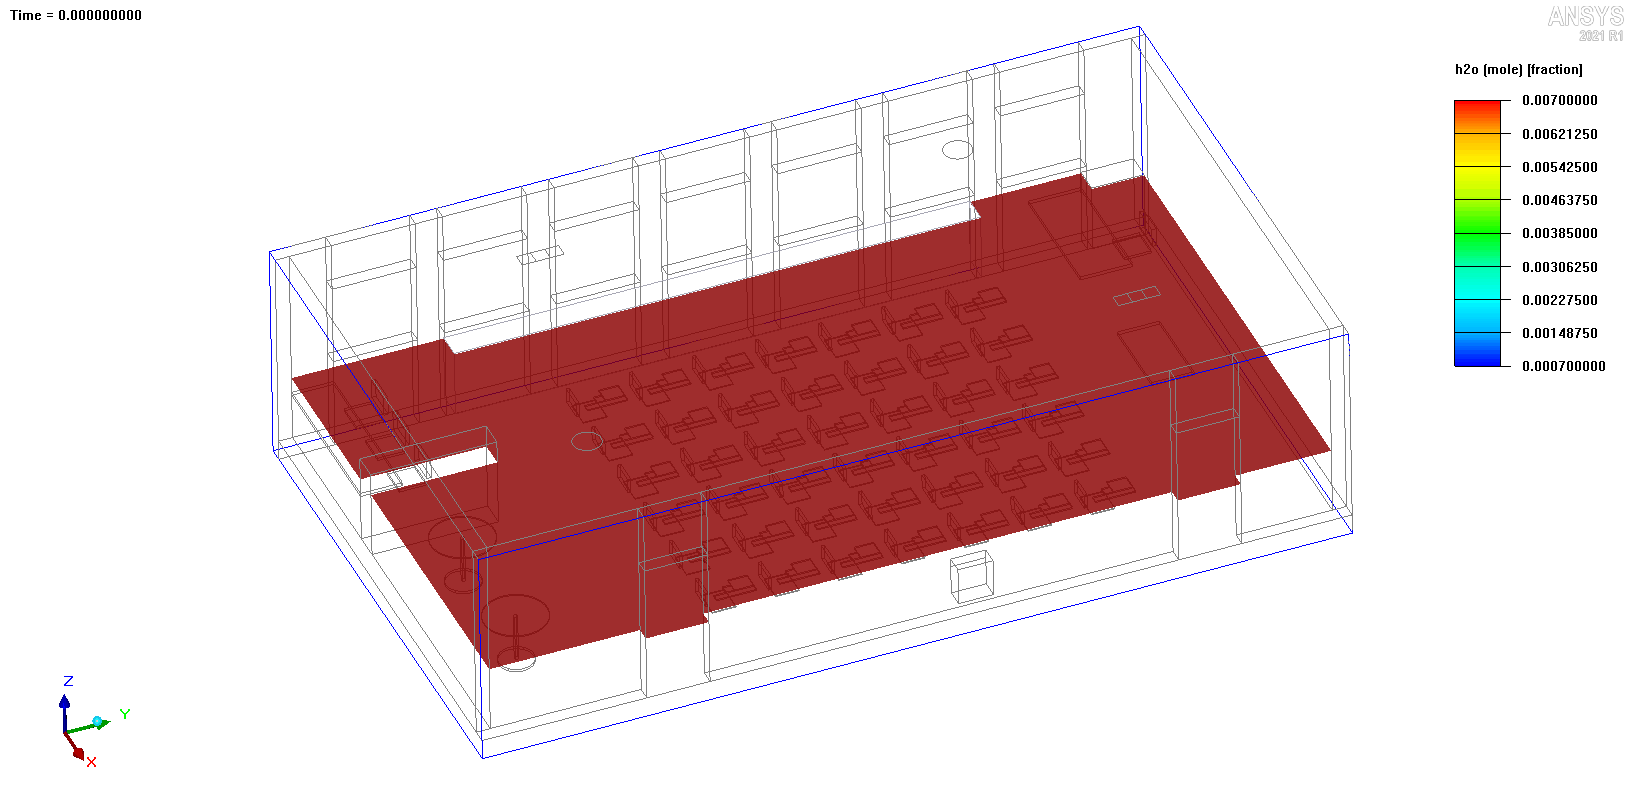
Ventilation at 1m about ground over 2 hour. at 420CFM supply.
In the above simulation we assume the room is filled with dirty air (Red). Then we start to vent in clean air (Blue). Blue color represent a 90% drop in the concentration old air. This is somewhat arbitrary but it is representative of the detailed air exchange data we can gather from simulations.
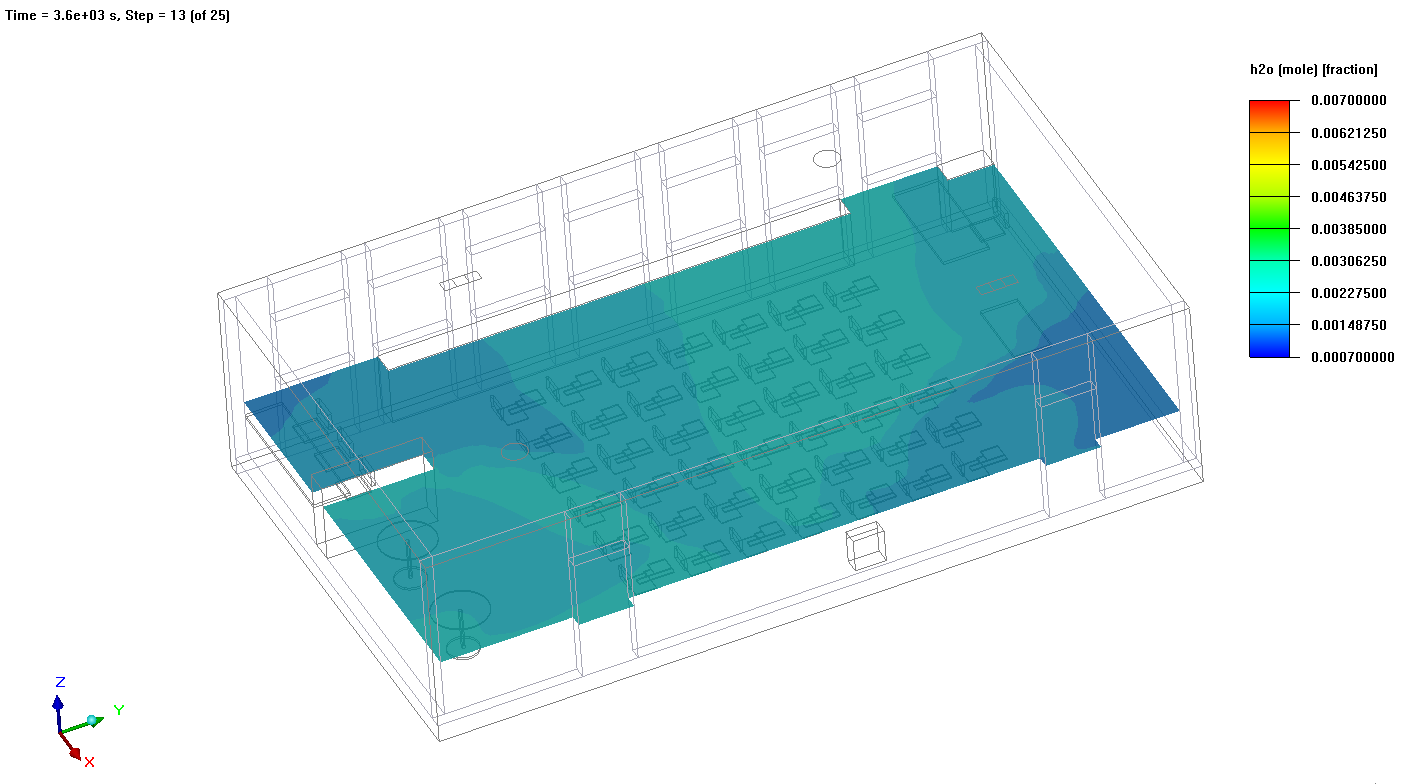
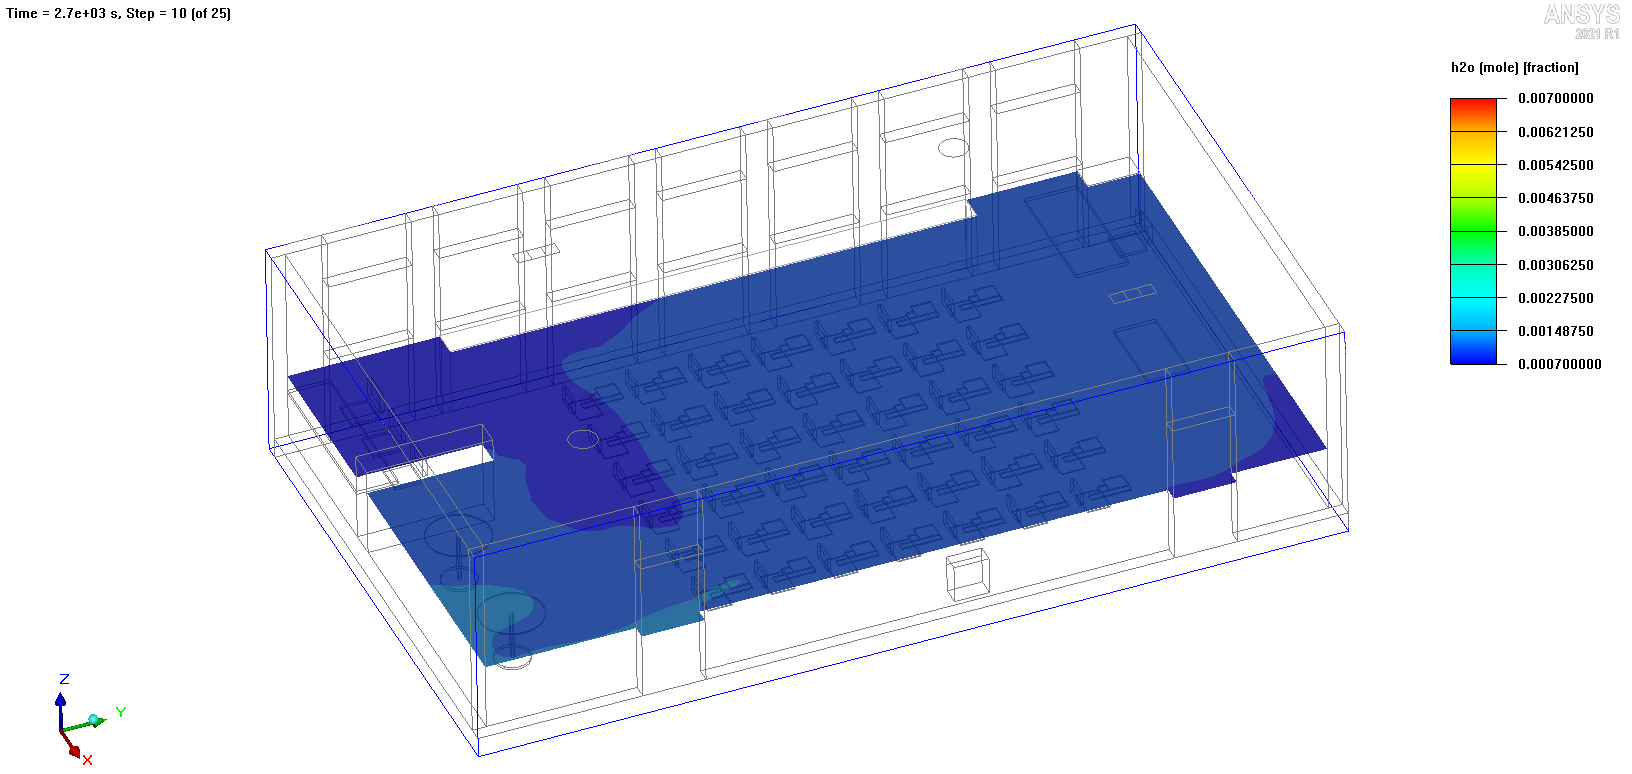
There are 2 realistic supply and 2 returns in this room. An ACH value of 2.73 should replace the room with fresh air every 22minutes or so. This is what the simulation shows.
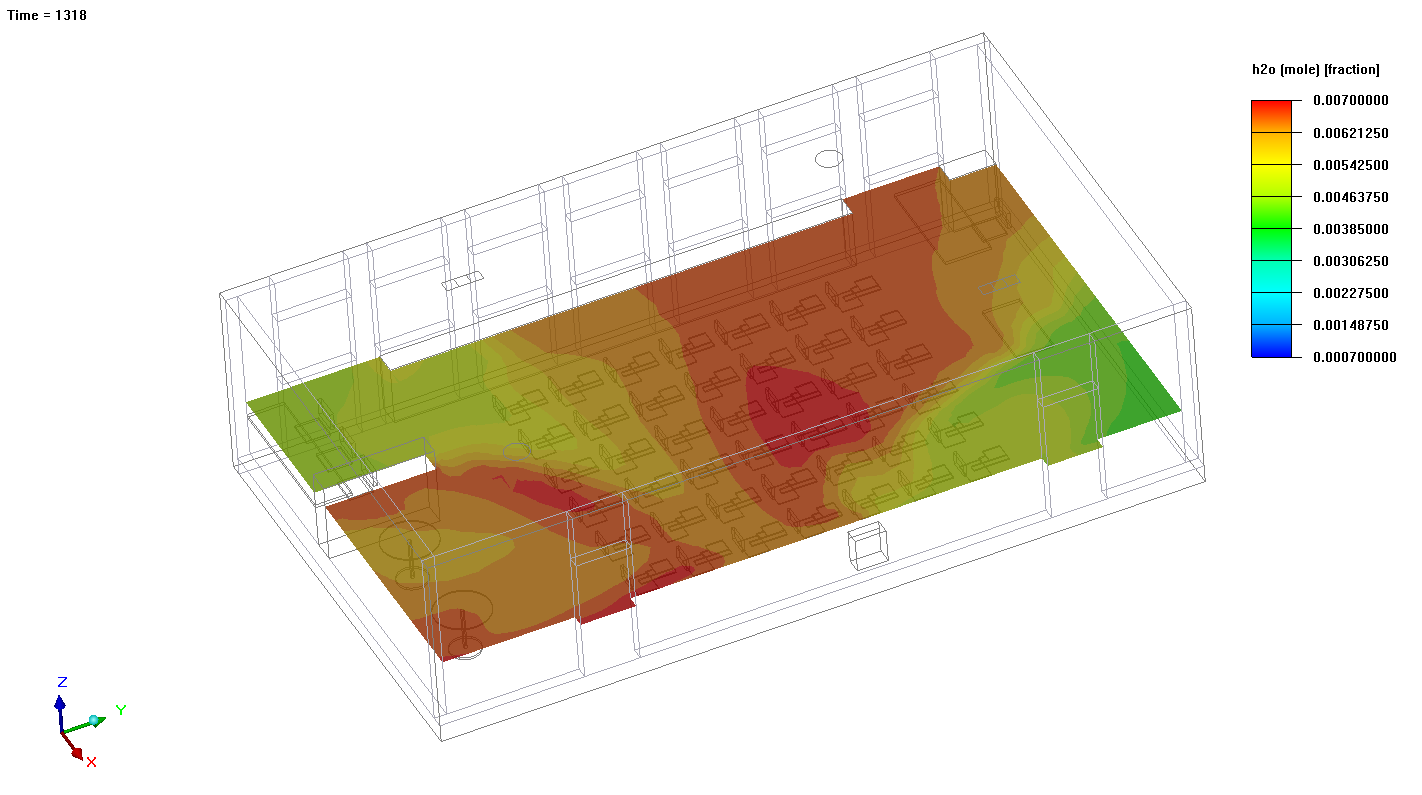
Baseline ventilation performance at 22min
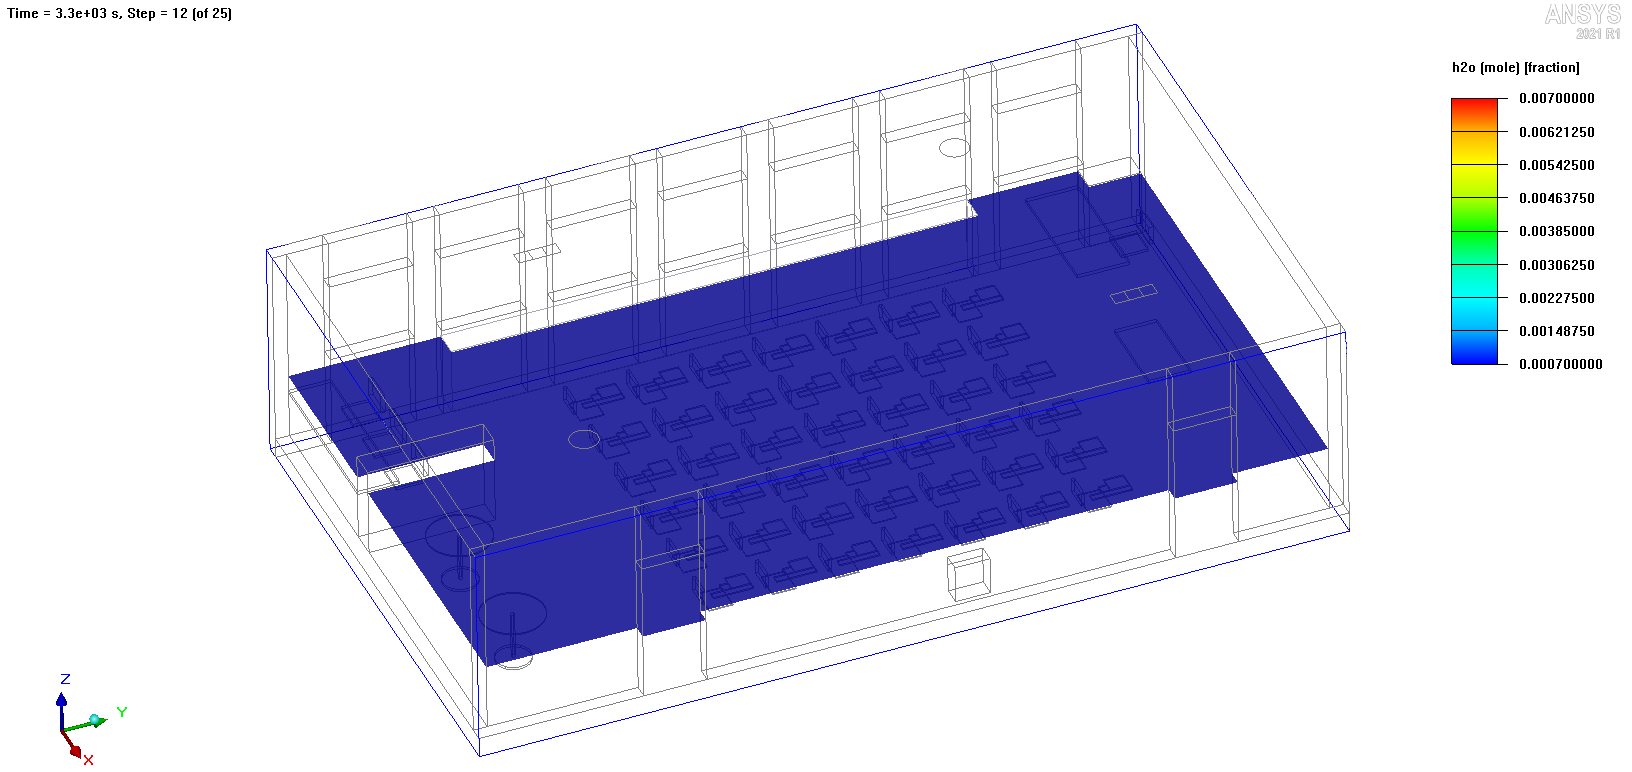
Simulation shows that after 22min, the room is still mostly filled with dirty/old air. This is because fresh air doesn’t replace old air like the hand calculations assume, rather the fresh clean air mixes with the old air.
Many infectious diseases end up and aerosols suspended in the air. To make in-door areas safe we need to move these aerosols out of the room and through filters. This means mixing fresh air with old air is not enough. We really want the occupants of the room to be exposed to only fresh air. But how long does that take?
After 60min
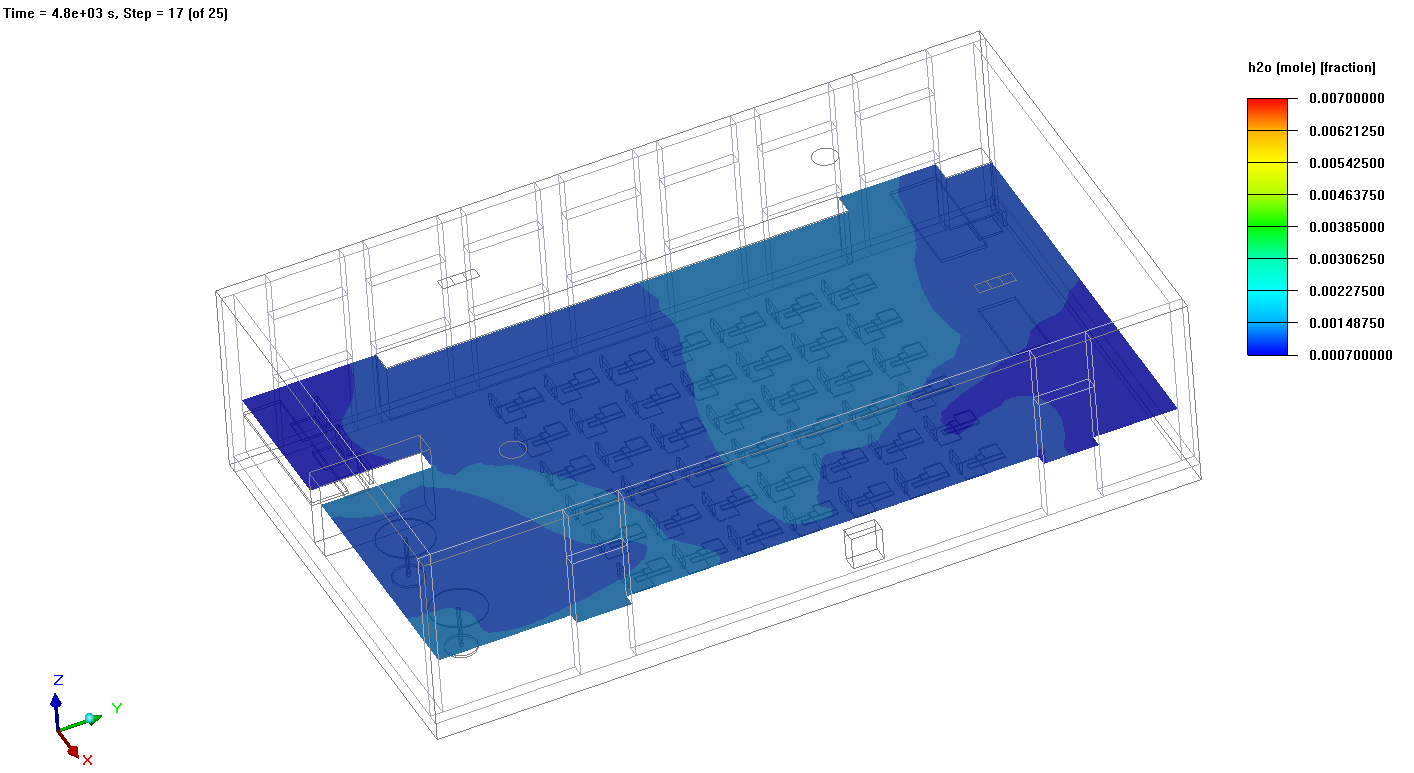
After 80min
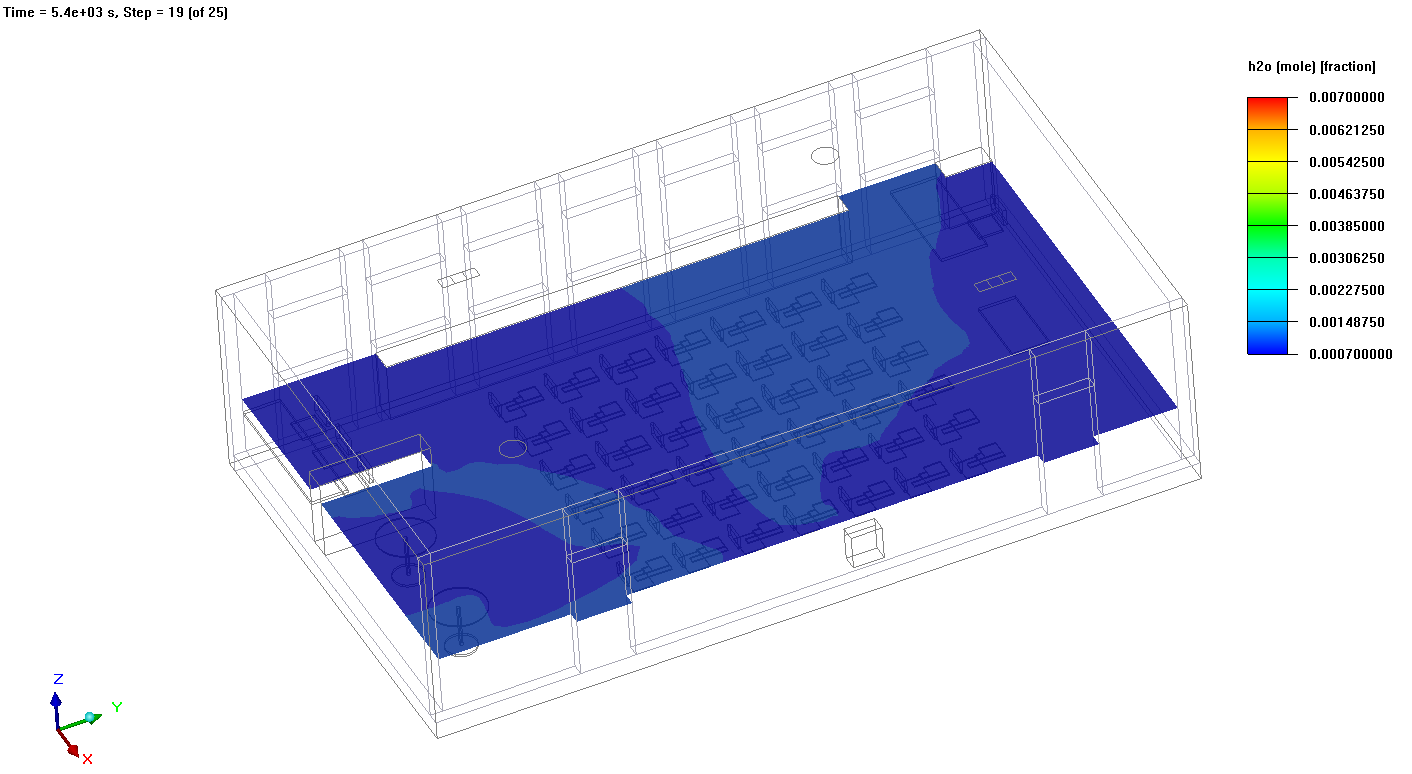
After 85min
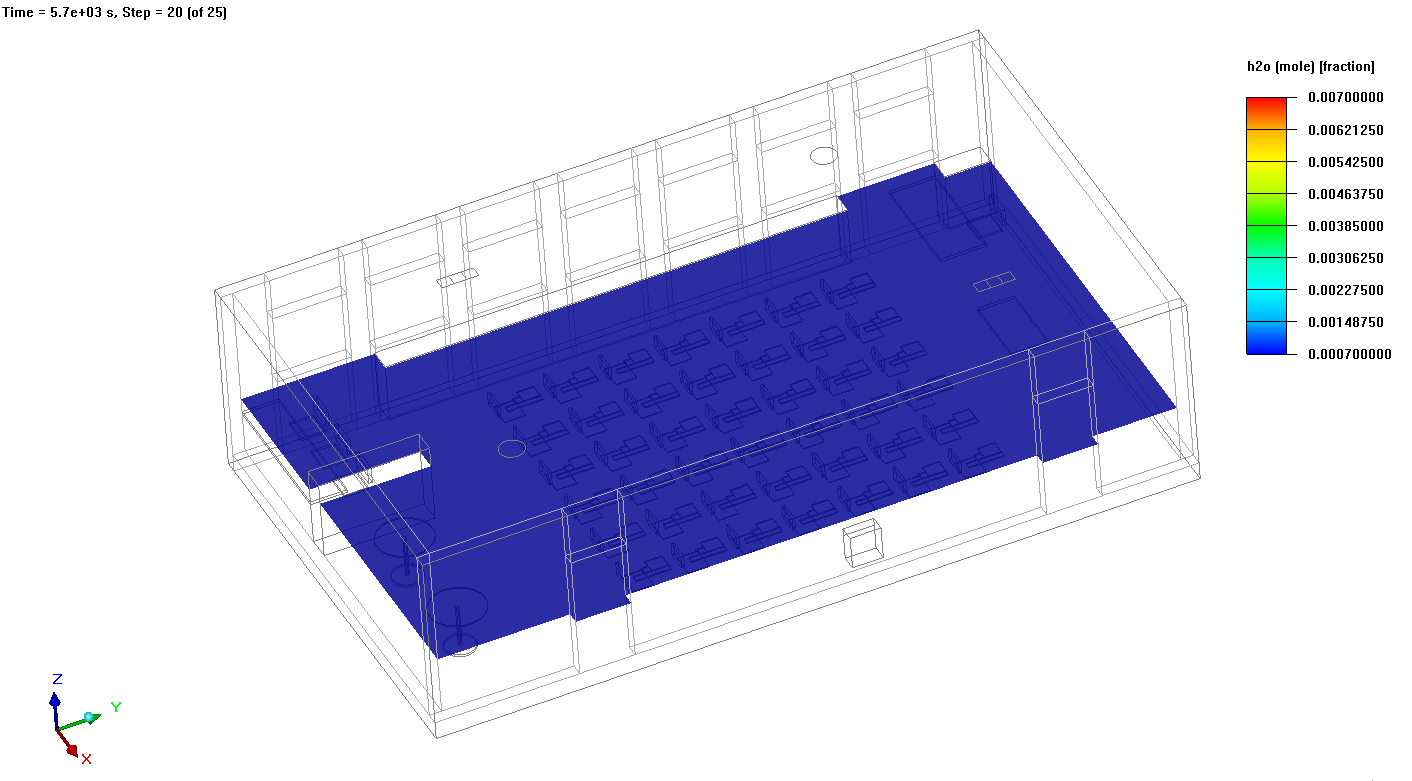
After 90min
The simulation results above shows that it takes almost 90min for the air to be totally replaced in the room. What happens when we crank up the HVAC system and try to reach 5 ACH for this room?
Ventilation at 1m about ground over 2 hour. at 762CFM supply.
After 45min
After 55min
With a much higher air supply, The room is totally cleared of old air after about 55min.
These simulations take into account the exact shape of the room as well as the location and orientation of the HVAC supply and returns. Other ventilation strategies can also be included in the simulation such as
-
Operable windows and doors
-
Ground or ceiling fans
-
Stand alone filtration systems
With computational fluid dynamics analysis we have much more data to evaluate the benefit of different ventilation strategies.
In future blog posts, we will explore now CFD simulation can be used to improve, optimize and find trade-offs among different ventilation setups.
If you are interested in ventilation simulations please contact us below.